
Refinement Tutorial
This is an introduction to the procedures for usingRefmac5 to refine a crystal structure.See also the documentation for Refmac5and Sketcher
The Problem
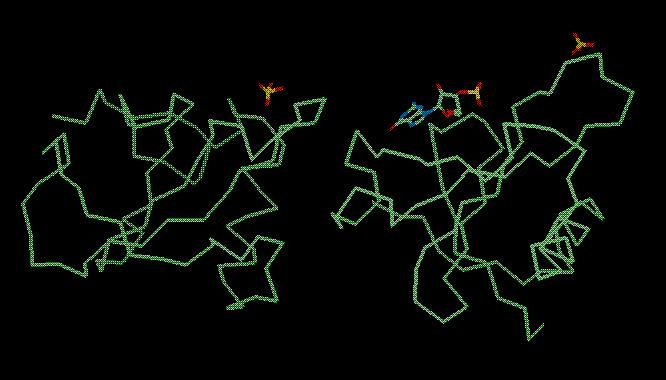
This example is to refine the protein RnaSa, this isThe final structure (solved by Joseph Sevcik: J. Sevcik, Z. Dauter, V.S. Lamzin, K. Wilson, Acta Cryst. D52 (1996) p327-344) looks like this:
What are Restraints?
There are 1749 atoms in the asymmetric unit - for each atom there are three parameters x,y,z and B (temperature factor) so that is 6996 parameters. In the experimental data there are 17991 reflections - this is ratio 17991/6996 = 2.57 This is not very much data. The best way to get more data is to use the information that we known about the geometry of molecules - the bond lengths and bond angles etc.. The refinement program will use restraints which say, for example, that two bonded atoms must be close to the correct bond length apart.Refinement programs have geometry libraries which contain information about the correct bond lengths, bond angles, planar groups etc.. for the chemical structures which are often found in crystallography (e.g. amino acids and nucleic acids). But if your structure contains an unusual molecule then it might not be in the monomer library. Often the most difficult thing in using refinement programs is making the geometry description so we will make the geometry description for the ligand to show how it is done.
Outline of the Method
1) Create the geometry description of the ligand.2) Use Refmac to find any more special restraints - for example the disulphide bonds. Check the results and make sure the special restraints are correct.
3) Run the Refmac program to refine the structure and
look at the result.
The Data Files
Files are in directory $DATAGMP.pdb The coordinates of the ligand molecule
rnasa.pdb The protein-ligand coordinates
rnasa_bad.pdb Some bad coordinates for rnasa.
rnasa.mtz The experimental data
The output files are in the directory $RESULTS
GMP_mon_lib.cif - The
monomer library description of GMP
review.log - The log file
from running Refmac5 to review restraints.
rnasa_bad_refmac1.pdb -
The output file from running Refmac5 to review restraints.
rnasa_bad.lib - The monomer
library file created by Refmac5.
refmac.log - The log
file from Refmac5 refinement.
rnasa_refmac1.pdb
The protein-ligand coordinates output by Refmac5
rnasa_refmac1.mtz
The experimental data with weighted differences output by Refmac.
Stage 1) Create a Monomer Library Entry for the ligand GMP
There are three ways to get a geometry description:a) There are over 2000 molecules in the Refmac
library so your ligand may already be in the library. In fact the
ligand in our example is in the library but we will not use it because
that is too easy.
A BIG WARNING: the data in the library is from crystal
structures in the PDB database - these may not be correct or exactly the
same as your ligand so always check.
b) If you have coordinates for the ligand in a PDB file - it is possible to make a monomer library entry very quickly - we will try doing this.
c) If you have no coordinates for the ligand then you need to draw the molecule and then the programs will make a geometry description and will also make a PDB files with coordinates. This can be made easier if there is a similar molecule in the library - you can get this molecule from the library and edit - we will also try doing this.
b) Creating Monomer Library Entry from Coordinate File
1.1) Change to the Refinement module and select the Monomer Library Sketcher task. See a picture hereFor the next steps see a picture here.
1.2) From the File menu at the top of the window select Read File and from the next menu select Read PDB file. Select the file:
Go to directory DATA
File
GMP.pdb
A message will come up informing you that a geometry file already exists and asks you if you wish to read the geometry information from this file. If you answer YES, go straight to step 1.7, skipping steps 1.3, 1.4, 1.5 and 1.6. If you choose NO, you will have to carry out these steps mentioned below.
1.3) You will see the molecule displayed. You can rotate it by holding down the left mouse button. On the right on the window is also the list of atoms (the list has the element, the atom name and the oxidation state (the charge on the atom). Below the list of atoms is a list of the chiral centres found in the molecule.
There is some information which is not in the PDB file which you must enter to give a full description of the molecule: the double bonds and the oxidation states.
1.4) The picture of GMP shows the correct double bonds - edit your molecule to have the correct double bonds. To change a bond to a double bond you must hold down the Shift key on the keyboard and click on the bond with the right mouse button.
1.5) The program has found three chiral centres in the molecule but it did not find the chiral centre a C3* because the atoms are nearly in a plane. We can add the extra chiral centre. Click on Add Row and enter:
4 C3* C4* C2* O3* -
1.6) Two of the oxygen atoms in the phosphate group are charged. Look at the table on the right of the window and find the atoms O31 and O32. Click on the menu in the oxidation state column and set the oxidation state to -1.
1.7) Now create the monomer library. From the File pull-down menu at the top of the window select Create Library Description. In the window enter the name of the ligand (this must be GMP which is the name of the ligand in the PDB file which we will refine). So
Unique identifier GMP Full name: guanosine 3 monophosphate
The names of files will be created
automatically so you can then select Run.
Close
this window now.
1.8) You must wait a little time - a program called Libcheck is running. When it is finished the molecule is displayed again.
1.9) Now look at the new monomer library file. Look at the CCP4i main window and select the last job which is called dictionary. Now select the View Files from Job menu (on the right side of the main window) and select the file GMP_mon_lib.cif
In this file you will see a list of the atoms..
loop_
_chem_comp_atom.comp_id
_chem_comp_atom.atom_id
_chem_comp_atom.type_symbol
_chem_comp_atom.type_energy
_chem_comp_atom.partial_charge
GMP
O6 O O
0.000
GMP
C6 C CR6
0.000
GMP
C5 C CR56 0.000
......
Further down the file is the list of bonds
_chem_comp_bond.comp_id
_chem_comp_bond.atom_id_1
_chem_comp_bond.atom_id_2
_chem_comp_bond.type
_chem_comp_bond.value_dist
_chem_comp_bond.value_dist_esd
GMP
O31 P3 single
1.699 0.020
GMP
O32 P3 double
1.610 0.020
GMP
O33 P3 single
1.699 0.020
GMP
P3 O3* single
1.610 0.020
The words at the top of the list tell you what is in each column:
comp_id
- this is the compound id - this is always GMP.
atom_id_1 -
this is the first atom in the bond
atom_id_2
- this is the second atom in the list
type
- this is bond type (single or double)
value_dist
- this is the ideal bond distance
value_dist-esd
- this is the standard deviation for the ideal bond distance
And also there is information on bond angle, torsion angle, chirality and planar groups.
The refinement program will try to make the ligand as defined in this file - you can edit the file if you need to.
c) Creating a Monomer Library Entry by Drawing the Molecule
This section is optional - you can go to Stage 2.If you have no coordinates or other definition of the ligand then you must draw the molecule in the sketcher. Sometimes there may be a similar molecule in the library - you can start from this and edit it. There is a guanosine molecule in the library which we can use to make GMP.
1.10) Delete any molecule that you have displayed - from the Edit pull down menu select Delete All Atoms.
1.11) From the File pull-down menu select Read File and then Load Monomer from Library. In the new window change the fifth line to
List RNA monomers
Now you will see a list of RNA monomers - click on the line:
Gr - Guanine
Then click on the Run Now button.
You must wait a little while before the molecule of guanosine is displayed. To make GMP you must delete the phosphate group on the O5* and draw a phosphate group on O3*.
For the next steps see a picture here
1.12) Make sure that the Mouse Mode (on the left of the Sketcher window) is set to Edit Monomer.
1.13) From the edit tools on the
left of the Sketcher window select the delete atom icon  from the edit tools on the left of the window.
1.14) Hold down the Shift key and click with the left mouse button on the atoms 01P O2P and P to delete them.
1.15) To add the new phosphate
group select the the 'add one atom' from the edit
tools. The atoms that you add will be carbon atoms - you will change
them later to phosphorus and oxygen.
from the edit
tools. The atoms that you add will be carbon atoms - you will change
them later to phosphorus and oxygen.
Make O3* the active atom by holding
down the Control key
and clicking on it with the right mouse
button. It is now the flashing, active atom. Now add another atom
by holding down the Shift
key and clicking with the left mouse
button close to the O3* at the place where the new atom should go.
You now have an atom called C21 and it is the active atom. Now click
close to this atom with Shift - left
mouse to make one more atom.
Now add two more atoms -
you will need to make the C21 atom the active atom (Control
- right mouse) and then add the atom.
When you have finished adding atoms click on the Do
nothing edit tool at the top left of the window - now you will not
make more atoms by mistake.
1.16) Now look at the end of table on the right side of the Sketcher window - the new atoms are C21, C22, C23 and C24. You see that each atom has the elment type C - change C21 to a P and the other three to O. The atom names are also wrong - change the names to P3, O31, O32 and O33.
1.17) The atoms O31 and O32 should have and oxidation state -1 so change the number in the third column for O31 and O32 to -1.
1.18) Finally look at the molecule again - there should be a double bond between the atoms P3-O33. To change this hold down the Shift key and click on the bond P3-O33 with the right mouse button.
1.19) Now we create the monomer library. From the File pull-down menu at the top of thewindow select Create Library Description. In the window enter the name of the ligand (call this TEST so you do not overwrite the files you made before). So
Unique identifier TESTFull name: guanosine 3 monophosphate
The names of files will be created
automatically so you can then select Run.
Close
this window now.
1.20) Wait while the program runs to build the dictionary
file. The molecule is drawn again. If necessary you can make
corrections and run again. To close the Sketcher window open the
File pull-down menu and select Close
Sketcher.
Stage 2 Create and Review Special Restraints
So you can see what happens we will use a file $DATA/rnasa_bad.pdb which I have edited to put in some bad things. The residue ARG B:63 is moved so that it is too close to ARG A:63.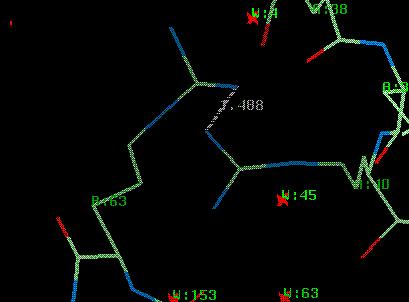
We will use Refmac5 in Review Restraints mode. The program will look at the atom coordinates and decide where there are disulphide bonds, cis-pepetides and D peptides. It will also calculate the distance between atoms and if they are very close then it will assume the atoms are bonded and will make a make a restraint to say 'these two atoms must stay close'. Of course this is not always right. It will also add any absent atoms - if a residue does not have the right atoms then it will make them. Refmac5 will help you by finding the disulphide bonds etc. automatically but you MUST check that they are correct.
2.1) From the Refinement menu in CCP4i main window select Run Refmac5.
For the next steps see a picture here
2.2) At the top of the window set:
Do review restraints
2.3) Now select the input coordinate file:
PDB in
DATA rnasa_bad.pdb
and use the new library file that you made for GMP:
Library
DATA GMP_mon_lib.cif
2.4) Look in the folder called Setup Restraints. In here you can decide what to look for in the PDB file. We will use the defaults - you do not need to change anything.
2.5) Now run the Refmac5 program. From the Run menu at the bottom of the window choose Run Now.
2.6) The job will take a little time. When it is finished it will say FAILED - this is OK. Look at the log file (click on the name of the job, refmac5, in the main window and use View Files from Job and ViewLog Files).
Some interesting things in the log file:
WARNING : CIS peptide bond
is found, angle = 6.49
ch:AA res: 26 GLY --> 27
PRO
....
WARNING : link:SS
is found dist = 2.027 ideal_dist=
2.031
ch:BB res: 7 CYS at:SG
--> ch:BB res: 96 CYS at:SG
These things are correct, Refmac5 has checked the input protein molecule and found some cis peptide bonds and some disulphide bonds, but there is also:
WARNING : description of link:ARG-ARG
not found in the dictionary.
link will be created with bond_lenth = 1.400
This is bad, Refmac5 will try to make bonds between the residues which are too close.
2.7) Now look at the output PDB file: use View Files from Job and select rnasa_bad_refmac1.pdb.
At the top of this file is new information..
LINK NH1 ARG A 40 . NE ARG B 63 ARG-ARG
LINK NH1 ARG A 40 . CZ ARG B 63 ARG-ARG1
LINK NH1 ARG A 40 . NH2 ARG B 63 ARG-ARG2
CISPEP 1 GLY A 26 PRO A 27 0.00
SSBOND 1 CYS A 96 CYS A 7
CISPEP 2 GLY B 26 PRO B 27 0.00
SSBOND 2 CYS B 96 CYS B 7Now Quit from the window.
2.8) It is necessary to edit the PDB file to remove the bad LINK information. There is an easy way to do this. From the Refinement menu in CCP4i main window select Edit Restraints in PDB .
2.9) Select the input file:
PDB in TEST rnasa_bad_refmac1.pdb
Wait while the program reads the file.
2.10) In the window you will now see:
The space group and the symmetry operators for the space group. (You may need this information to define disulphide bonds or links between molecules that are not in the same asymmetric unit).
The MODRES Ids and LINK Modes - this is information from the dictionary. The MODRES are possible modifications that you can make to a residue and the LINKs are different ways to link two monomers (of amino acid, nucleic acid or sugar).
MODRES - Modified Residues. This is a way to define any non-standard residues. There are none in the rnasa protein.
SSBOND - Disulphide Bonds. The two disulphide bonds in rnasa are shown.
LINK - Inter-Residue Bonds. The three bad bonds are listed.
CISPEP - Cis peptides. The two cis-peptides in rnase are listed.
2.11) You can delete the bad LINKs by clicking on the menu Edit Table and selecting Delete Last Row. Do this three times. See a picture here
It is also possible to add new things - try clicking on Add Row.
2.12) We will stop using the rnasa_bad so you do not need to save changes - Close the window.
Stage 3 Refining the Molecule
Now we will use the monomer library description that we created to refine the rnasa molecule with the GMP ligand.3.1) From the Refinement menu in CCP4i main window select Run Refmac5.
For the next steps see a picture here
3.2) At the top of the window set:
Do restrained refinement using no prior phase information input
Also you will see:
 Generate
weighted difference maps in CCP4
format.
Generate
weighted difference maps in CCP4
format.
If you have a graphics program to look at the maps then click this on and select a map format.
3.3) Now select the input files - the experimental data:
MTZ in DATA rnasa.mtz
and make sure you have correct data columns:
FP FGMP18 SIGFP SIGFGMP18
and the coordinate file:
PDB in DATA rnasa.pdb
To use the geometry description file which you have made
Library test GMP_mon_lib.cif
3.5) Now run the Refmac5 program. From the Run menu at the bottom of the window choose Run Now.
3.6) The job will take a little time. When it is finished look at the log file (click on the name of the job, refmac5, in the main window and use View Files from Job and ViewLog Graphs).
It you do not have a log file then click on View Any File and set
Go to directory RESULTS
File type
log CCP4 log
filename filter *.log
Viewer
View Log Graphs
and then select file
File refmac.log
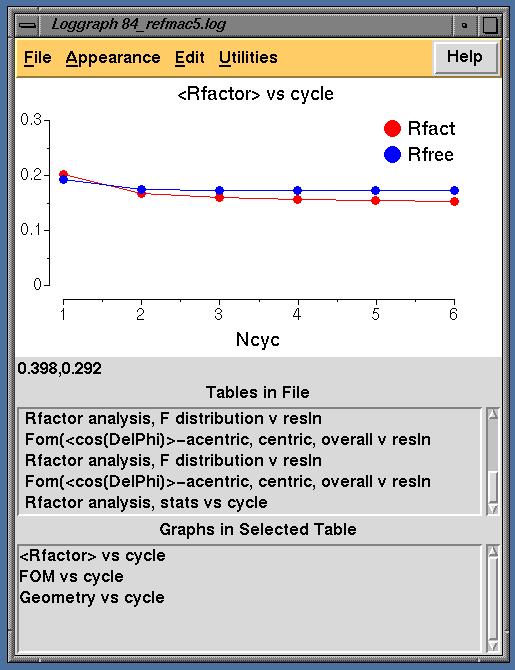
Go to the last table in the Tables in Files and click on:
Rfactor analysis, stats vs cycle
You will see a graph of the R factor and the Free R factor for the 6 cycles of refinement. The R factor is very good already but both go down a little.
Also look at the Graphs in Selected
Table for
FOM vs cycle
Geometry vs cycle
The FOM tells you how well the molecule matches the experimental data and the Geometry tells you how well the molecule obeys the geometry restraints.
Also up the Tables in File list and select the last
Rfactor analysis, F distribution v resln
This is information about the last cycle of refinement. If you look at
<Rfactor> v. resln
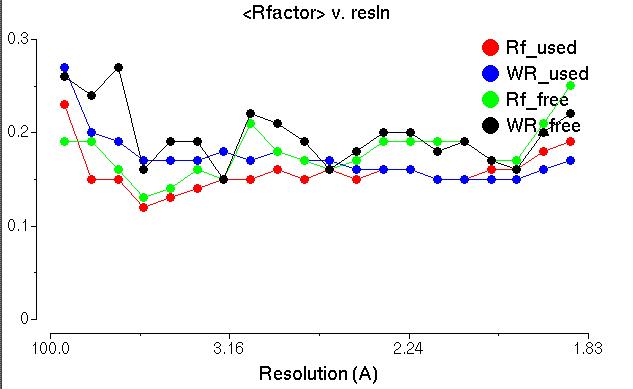
The red line is the average R factor versus resolution for the data which is used and the green line is the Free R factor (for the 'free' data which is not used). This is similar for all resolution - it does not go up for high resolution data. This is example of what is good about maximum likelihood refinement compared with the old-fashioned least squares.
Also look at the graph
<Fobs> and <Fc> v. resln
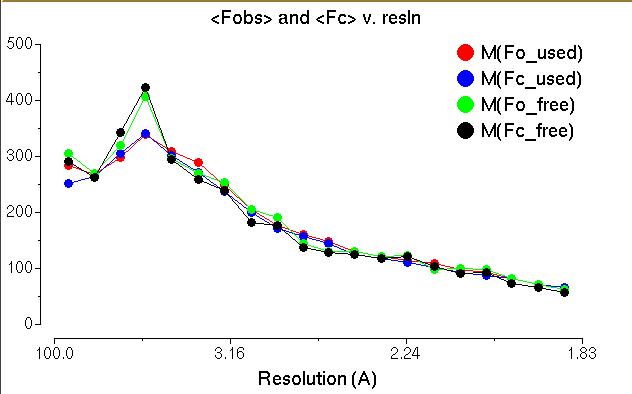
This is a graph of the average observed structure factors and calculated structure factors. You notice that at low resolution the observed (red) and the calculated (blue) are not the same. At low resolution the water atoms, which we can not see in the crystal structure, are an important part of the structure factors. The refinement program tries to model the water atoms by solvent scaling but it is difficult for this data because some of the very low resolution data is missing.
To close the loggraph window click on the File menu and select Exit
3.7) Look at the header of the output MTZ file - click on View Files from Job and select the file rnasa_refmac1.mtz. In the file you will see:
* Column Labels :
H K L FNAT SIGFNAT FreeR_flag FC PHIC FWT PHWT DELFWT PHDELWT FOM
The new data in the file is:
FC & PHIC
- the structure factures and phases calculated from the final coordinates
FWT & PHWT
- the 'best' structure factors and phases weighted by the maximum likelihood
function
DELFWT & PHDELWT
the 'best' structure factors and phases for a difference map
FOM this
is a figure of merit for PHIC
If you selected the option to create output maps then you can look at the maps created from the Refmac output.
...FWT.map - the 'best' weighted map
...DELFWT.map - the 'best' weighted difference map
An example of these maps is shown below for a a tyrosine
residue which is in the wrong place.
The DELFWT map is the weighted difference map of F(observed)
- F(calculated) and looks like this:
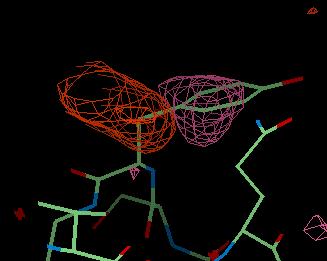
Here you can see a large pink area of negative density where the tyrosine side chain is now. This is saying that the side chain should not be here. The large (brown) area of positive density is showing where the side chain should be.
The FWT map is the weighted map and looks like this:
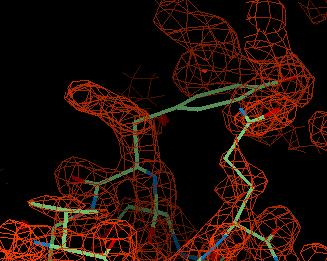
You can see region of density to the left of the tyrosine
which is where it should go.
To find out more
Refmac: http://www.ysbl.york.ac.uk/~garib/refmac
Libcheck: http://www.ysbl.york.ac.uk/~alexei/libcheck.html
CCP4: http://www.dl.ac.uk/CCP/CCP4
Prepared by Liz Potterton (lizp@ysbl.york.ac.uk) and Eleanor Dodson, July 2000